How to Do Load Testing for APIs


If you’ve ever developed a web application designed to handle a significant volume of users, you’ve faced the question of determining what resources your application needs to handle expected traffic with desired service levels. Performance and load testing allow you to understand how your application will behave in different usage scenarios by answering the following questions:
How many resources (CPU, RAM, disk, bandwidth, GPU, etc.) does my application consume to process traffic?
What infrastructure do I need to respond to expected traffic?
How fast is my application?
How quickly does my infrastructure scale? What impact does scaling have on users?
Is performance stable or does it degrade over time?
How resilient is my application to traffic spikes?
How does my application’s performance change with new features being introduced?
The goal of this post is to provide tools to answer these questions for your application. We’ll start with a theoretical introduction to performance and load testing, then move to a practical second part where we’ll see how to perform load testing on an API from an example project.
Testing Strategy (Theoretical Part)
Before approaching the creation of the test plan, you need to analyze how the API is defined and how it will be used in production to determine how to conduct the tests.
In this specific case, we’re going to test the API of a web application for a Blog. This API consists of several endpoints for user management and posts. Considerations:
Since each endpoint has different business logic, their performance and supported throughput are expected to be different.
Tests should be based on the expected number of users for our application. It doesn’t make sense to test with 100k concurrent users if our application likely won’t exceed 100.
First, it’s recommended to test each endpoint separately to understand the limits and capabilities of each one in isolation. As a next step, test with call patterns (to various endpoints) that reproduce real use cases (For example, a user logs in, then lists posts, retrieves 2 or 3 specific posts, etc.).
If the application isn’t in production yet, we’ll have to create tests based on hypotheses we believe can represent reality. Once the application is deployed in production, we can use real usage data to update the tests.
If the system has auto-scaling, the test will allow testing auto-scaling and understanding its speed, errors between auto-scaling events, etc. In this specific case, the application we’re going to test doesn’t have auto-scaling.
What to Measure
Resource usage: CPU, RAM, network traffic, …
Call latency: the latency of the call (including response) to each API endpoint. There are different ways to measure latency; percentiles are normally used. For example, if p95 (or 95th percentile) is 85ms, it means that 95% of calls complete in at most that time.
Throughput, measured as the number of calls to an endpoint per second (RPS or requests-per-second) that the backend accepts under different conditions.
Error rate or number of calls that respond with error versus total number of calls.
Types of Performance Tests
Within performance tests, different types are distinguished based on load or data volume. The goal is to represent different usage situations our system may experience in production:
Baseline or average tests. They help understand how the API behaves with a number of calls we consider normal. In our example, we’ll consider that under normal conditions we’ll have 20 concurrent users making requests to the API.
Load testing. They allow us to understand how the API responds when expected usage peaks occur. For example, if we’ve calculated that during peak hours we’ll have 50 users making requests to the API, the test will reproduce a traffic pattern that reaches that peak.
Stress testing. They help understand the maximum capacity of our API (measured in RPS, requests per second) with current infrastructure, how auto-scaling behaves (if available), and how performance degrades (latency) and error rate increases (in case of fixed capacity) as traffic increases. Some examples of situations that could stress a system would be Black Friday in e-commerce or a sporting event in a food delivery service.
Spike testing. They allow seeing how the system behaves when facing sporadic traffic spikes. And see how many calls we can respond to correctly and how many with errors. They also allow checking if the service is resilient and stays active or conversely crashes. In the real world, these spikes can occur for different reasons, such as if someone popular writes a tweet referencing our website and many visits occur simultaneously (also known as “HackerNews hug of death”).
Soak testing (Durability testing). They allow understanding API behavior over extended periods, which can last days or weeks. They aim to check if there are system degradations that could affect the service in the medium-long term. For example, if we have a small memory leak in the application, it could take days to consume all allocated RAM, which would likely cause a service restart and failure of all calls the service was handling at that moment (and calls that occurred during the time until the service is up again, if there aren’t other service instances available to absorb traffic).
Goals and Plan (Practical Part)
For brevity, we’ll focus on baseline tests and stress tests. However, it’s not complicated to design load and durability tests from the information we’ll share.
To avoid extending the post too much, the tests will consist of testing a single endpoint (post listing). Leaving the reader the task of expanding and adapting the tests to their application and specific use cases.
The plan will be as follows:
- Stack and test project description
- Environment description
- Environment deployment
- Baseline Testing
- Stress Testing
- Final notes
1 — Stack and Test Project Description
For test execution, we’ve decided to create a backend in GO that implements a simple REST API and uses a MariaDB database for data persistence. The code along with deployment instructions can be found here:
https://github.com/gerodp/blog-sample-backend-go-grafana
Note: This is a test backend for illustrative use only and is not intended for production environments.
On the other hand, we’ve created another repository with different tests, which we explain below:
https://github.com/gerodp/blog-sample-perf-test-k6-grafana
Stack
- REST API Backend in GO with GIN (HTTP Server) and GORM (ORM) libraries
- Load testing tool: Grafana K6.
- System monitoring with Prometheus and Grafana
- MariaDB database
- Execution and orchestration with Docker and Docker Compose
About Grafana K6 — Load Testing Tool
K6 is an Open Source solution developed by Grafana Labs. We’ve selected it because it’s easy to use, supports all types of performance tests, has good integration with Grafana and Prometheus monitoring tools, and has excellent documentation in several languages, including Spanish.
However, there are a large number of tools of this type that could also be used, such as: JMeter, Locust, Taurus, Artillery, or others.
2 — Environment Description
For simplicity, we’ll deploy the backend that implements the API on an AWS EC2. This type of deployment is very simple and isn’t intended for production environments; in those cases, it’s recommended to explore other solutions like cluster deployment or other alternatives.
In the repository README we can read the steps to install it on an EC2 or compatible Linux machine.
3— Environment Deployment
As part of the test, we have 2 differentiated components: 1) the backend that implements the API and 2) the K6 load tests
Backend API Implementation Deployment
1 — We launch an AWS EC2 with Linux. In our case, we’ve tested it on a t3.large and m5.large with Ubuntu, but other smaller instances work perfectly (it will just take a bit longer to start the backend due to Go compilation). And we’ll need to assign it a public IP address to access from outside.
2 — In the Security Group, we add 2 inbound traffic rules to ports 22 (SSH) and 9494 (port where the API is exposed) from our home IP or the machine where we’ll launch the K6 tests.

3 — We connect via SSH to the machine and execute the following commands (in the README):
https://github.com/gerodp/blog-sample-backend-go-grafana#deployment-in-aws-ec2
4 — We can open an SSH tunnel to access Grafana with this command:
ssh -i "/path/to/pemfile" -N ubuntu@<PUBLIC_IP> -L 8800:localhost:3000
5 — And we go to http://localhost:8800 with a browser to open Grafana.
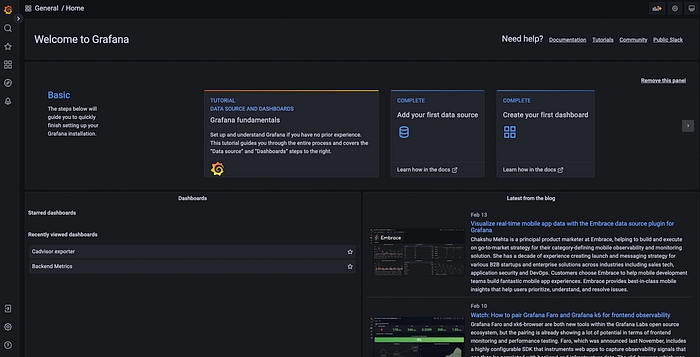
Test Deployment
We can run the tests directly on our machine if the system we’re going to test is small, or launch dedicated infrastructure when the system is larger. K6 has a Kubernetes Operator that allows this. For this post, we’ll launch them from our machine for simplicity (In this case, a Mac with M1 chip).
1- Clone the repository:
https://github.com/gerodp/blog-sample-perf-test-k6-grafana
2- Launch a test by executing this command with make:
API_URL=http://EC2_PUBLIC_IP:9494 TEST=testfile.js make start
The command launches several containers:
- A container with K6 that executes the test specified in testfile.js, and listens for changes in that file to relaunch it every time it’s saved
- A container with Prometheus and another with Grafana for monitoring
3- Open Grafana in a browser by visiting http://localhost:3000
4- We can terminate the test container execution, as we’ll launch them again in the next section with a specific test.
Note: As we can see, we have 2 Grafana instances, 1 for the API (with API backend resource usage metrics) and another for Tests (with metrics K6 generates about test execution: throughput, latencies, error rates, etc.). From here on, we’ll refer to each Grafana instance by specifying whether it’s for Tests or API.
4 — Baseline Testing
Let’s assume that under normal conditions our Blog will have around 20 concurrent users who make one call to the post listing API per second (this is a fictional scenario, as the real traffic pattern will probably be different, but it serves as an illustration).
If we go to the repository with K6 tests and open the file:
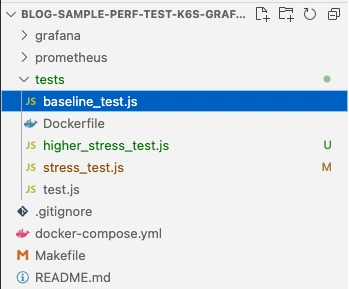
We’ll see the following content:
import http from "k6/http";
import { check, sleep } from "k6";

export const options = {
 thresholds: {
   http_req_failed: ['rate<0.01'], // http errors should be less than 1%
   http_req_duration: ['p(95)<200'], // 95% of requests should be below 200ms
 },
 scenarios: {
   read_posts_constant: {
     executor: 'constant-arrival-rate',

     // Our test should last 10 minutes in total
     duration: '600s',

     // It should start 20 iterations per `timeUnit`. Note that iterations starting points
     // will be evenly spread across the `timeUnit` period.
     rate: 20,

     // It should start `rate` iterations per second
     timeUnit: '1s',

     // It should preallocate 55 VUs before starting the test
     preAllocatedVUs: 55,

     // It is allowed to spin up to 80 maximum VUs to sustain the defined
     // constant arrival rate.
     maxVUs: 80,
   }
 }
};

//This function runs only once per Test
//and performs a login
export function setup() {
 let loginParams = { username: 'testint1', password: 'testint1'};

 let loginRes = http.post(__ENV.SERVICE_URL+'/login', JSON.stringify(loginParams), {
   headers: { 'Content-Type': 'application/json' },
 });
 check(loginRes, {
   "status is 200": (r) => r.status == 200,
 });

 return { token: loginRes.json().token };
}


export default function(data) {
 const token = data.token;

 let resp = http.get(__ENV.SERVICE_URL+"/auth/post?page_size=5",{
   headers: {
     'Content-Type': 'application/json',
     'Authorization': 'Bearer ' + token,
    },
 });

 check(resp, {
   "status is 200": (r) => r.status == 200,
 });

 sleep(1);
}
We won’t explain all the code details, as they can be consulted in the excellent k6 documentation. But let’s comment on the most important parts:
thresholds: {
   http_req_failed: ['rate<0.01'], // http errors should be less than 1%
   http_req_duration: ['p(95)<200'], // 95% of requests should be below 200ms
 },
K6 allows defining our SLOs (Service level objectives) directly in the code. For our test, we’ve set that we want the 95th percentile latency to be less than 200ms and the error rate to be less than 1%. If any of the SLOs aren’t met, K6 will indicate it in the results report shown when test execution finishes.
 executor: 'constant-arrival-rate',

 // Our test should last 10 minutes in total
 duration: '600s',

 // It should start 20 iterations per `timeUnit`. Note that iterations starting points
 // will be evenly spread across the `timeUnit` period.
 rate: 20,

 // It should start `rate` iterations per second
 timeUnit: '1s',
Since we want a constant call rate per second, we choose this executor that guarantees ‘rate’ iterations start per ’timeUnit’. To learn more about available executors, we can visit K6 documentation.
To launch it, we execute the following command:
API_URL=http://EC2_PUBLIC_IP:9494 TEST=baseline_test.js make start
After 10 minutes, we’ll get the test result in the logs:
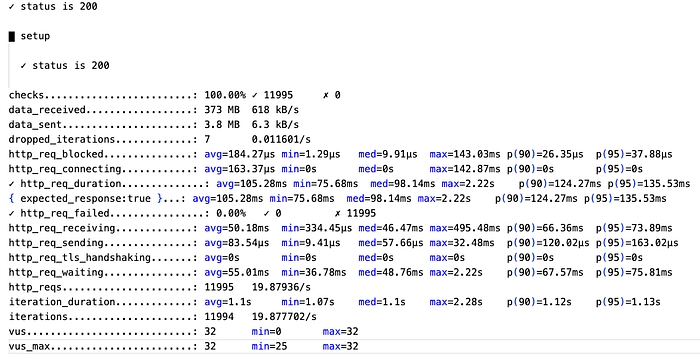
The ‘checks’ line in the report tells us that 100% of checks have passed.

‘http_req_duration’ shows us call latency (measured from the K6 client; note that latency will be highly proportional to the distance between the machine where the K6 client launching the test runs and the machine where the system being tested runs). The p(095) or 95th percentile is 135.53ms which means 95% of calls have completed in at most that time. This is below the SLO we set of p95<200ms. On the other hand, the average latency is 105.28ms.

If we go to the Tests Grafana (http://localhost:3000) and open the Test Result dashboard, we can see curves with RPS, Active VUs (K6 Virtual Users), and average Response Time (average latency)
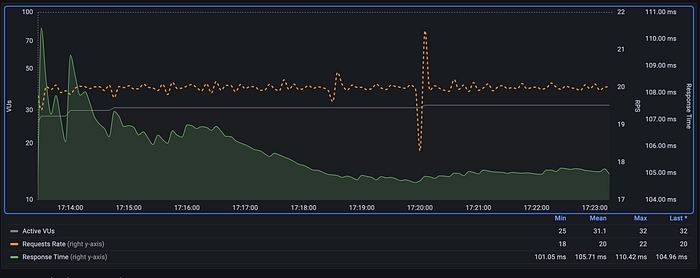
As observed, RPS (orange dashed curve) has been maintained at 20 RPS, as we specified in the test. The Average Response Time (green curve), while it’s true that at first glance it shows greater change at the beginning then becomes more or less constant, the difference between maximum and minimum average value is less than 10%, which is in line with expectations. In general, small variations in measurements are expected since there are many factors that can affect times, from system load at the time of the test to network status.
On the other hand, we can see that no errors have occurred, or in other words, the error rate has been 0%, which means we’ve met the other SLO that established the error rate should be below 1% of calls.

So far, everything seems to indicate that the API behaves as expected, without errors and with constant response latency. This isn’t conclusive that there can’t be other problems that could affect the future. For that, we’re interested in checking that CPU and RAM resource usage of services is adequate and doesn’t show upward trends that could signal a future problem.
If we go to the Cadvisor exporter grafana dashboard, we find resource usage metrics. In the first graph, we can observe CPU consumption for different services. As seen, CPU usage is very low for both services, with a small increase at the beginning of the test, then it stabilizes

Memory usage is 18.4 MB for the backend and 96.9 for MariaDB, and the curves remain flat.

With these checks, it seems the system behaves stably in terms of performance, and without indicators that a problem could occur with 20 concurrent users and the usage pattern defined in the test. However, to have greater certainty that the system behaves stably over longer periods, it’s recommended to do soak testing.
Depending on the technologies we use, we can expand monitoring to more metrics. For example, if our database is MySQL or MariaDB, we can use a Prometheus exporter that exposes a large number of metrics, from the number of active connections to query latency, and they’re useful for knowing system load in more detail. On this page we can find a detailed list of prometheus exporters for metric collection based on technology.
Next, we’ll proceed to do stress tests to see how the API behaves when the load is much higher.
5 — Stress Testing
As we’ve observed in the previous test, with 20 users the system behaves as expected. We can start with 25 RPS, for example, and keep increasing the load to 50, 100, 150, …. K6 supports several ways to do this, but to understand how to do it, we first need to introduce some concepts about K6.
K6 Virtual Users (VUs) and Iterations
In K6, each Virtual User consists of a while loop that executes the test function we’ve defined in the K6 file in a loop. Each execution of the loop is called an iteration. If we define 10 VUs, we’ll have 10 while loops executing iterations in parallel. A VU only executes one iteration concurrently, and the next iteration doesn’t begin until the previous one ends. Therefore, the number of iterations a VU can execute is defined by how fast or slow the system being tested responds. This means that if in our test we want to reproduce N number of users, we’ll need to use a VU-type executor, and if what we want is to reproduce N number of RPS (requests per second), it’s ideal to use an iteration-type executor, which will dynamically adapt the number of VUs to reach the iterations specified in the test. K6 provides different types of executors that determine how tests are executed. To learn more about available executors, we can visit K6 documentation.
For this specific case, we’re going to use the Ramping Arrival Rate executor that allows specifying the number of iterations to execute per time unit, since we’re interested in knowing our system’s capacity with respect to RPS. Since we only make one call in our test, the number of iterations will be equivalent to RPS.
We’ll make each step 60 seconds of ramp-up plus 60 seconds with stable rate. It’s important to consider how often Prometheus samples data; if the test is too fast, Prometheus won’t be able to capture metrics and changes well.
Step 1: 0 -> 25 RPS.
To achieve 25 RPS in 60 seconds, I need to execute 25*60 iterations -> 1500 iterations
Step 2: 25 -> 50 RPS -> 50*60 = 3000 iterations
etc..
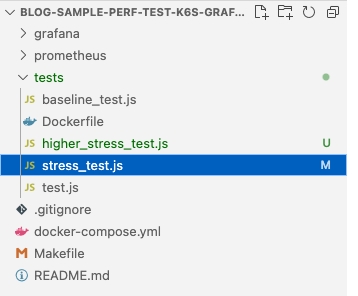
If we go to the repository with K6 tests and open the file:
import http from "k6/http";
import { check, sleep } from "k6";

export const options = {
  thresholds: {
    http_req_failed: ['rate<0.01'], // http errors should be less than 1%
    http_req_duration: ['p(95)<200'], // 95% of requests should be below 200ms
  },
  scenarios: {
    read_posts_stress_test: {
      executor: 'ramping-arrival-rate',

      // Our test with at a rate of 50 iterations started per `timeUnit` (e.g minute).
      startRate: 25,

      // It should start `startRate` iterations per second
      timeUnit: '1m',

      // It should preallocate 300 VUs before starting the test.
      preAllocatedVUs: 300,

      // It is allowed to spin up to 1500 maximum VUs in order to sustain the defined
      // constant arrival rate.
      maxVUs: 5000,

      stages: [
        { target: 25*60, duration: '1m' },
        { target: 25*60, duration: '2m' },
        { target: 50*60, duration: '1m' },
        { target: 50*60, duration: '2m' },
        { target: 100*60, duration: '1m' },
        { target: 100*60, duration: '2m' },
        { target: 150*60, duration: '1m' },
        { target: 150*60, duration: '2m' },
        { target: 25*60, duration: '3m' },
      ],
    }
  }
};

//This function runs only once per Test
export function setup() {
  let loginParams = { username: 'testint1', password: 'testint1'};

  let loginRes = http.post(__ENV.SERVICE_URL+'/login', JSON.stringify(loginParams), {
    headers: { 'Content-Type': 'application/json' },
  });
  check(loginRes, {
    "status is 200": (r) => r.status == 200,
  });

  return { token: loginRes.json().token };
}

export default function(data) {

  const token = data.token;

  let resp = http.get(__ENV.SERVICE_URL+"/auth/post?page_size=5",{
    headers: {
      'Content-Type': 'application/json',
      'Authorization': 'Bearer ' + token,
     },
  });

  check(resp, {
    "status is 200": (r) => r.status == 200,
  });

  sleep(1);
}
To launch it, we execute the following command:
API_URL=http://EC2_PUBLIC_IP:9494 TEST=stress_test.js make start
After 15 minutes, we’ll get the test result in the logs:
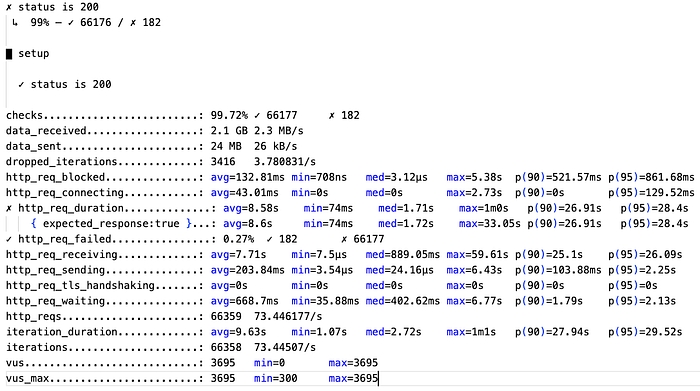
As can be seen in the results, the last line indicates that some of the defined thresholds (with SLOs) have failed. The p95 latency is 28.4s, which is well above the 200ms marked as objective. However, the error rate of 0.27% has remained below the 1% set as objective.
If we open the Test Result dashboard in Grafana, we can see in the graph the evolution of latency as RPS increases.
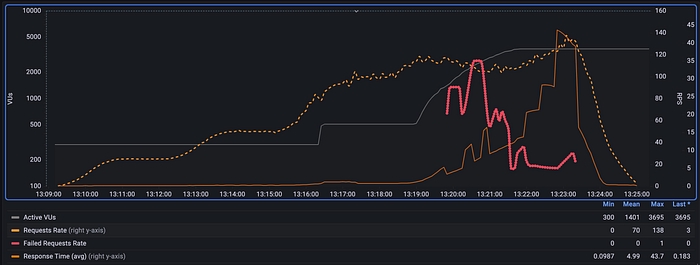

If we zoom in on the API Call Response Time graph, we see the moment when p95 latency exceeds the 200ms threshold (red line). If we observe the RPS value in the other graph at that time instant, we see it’s around 22 RPS. This means that with current infrastructure, we shouldn’t exceed this limit if we want to meet the latency SLO.
However, beyond this point, the system continues functioning without errors (although with high latency) until reaching around 115 RPS, when some errors start occurring.

Another thing we can observe is that maximum RPS achieved are around 138, although our goal was to reach 150 RPS. This occurs because latency increases so much that the maximum number of VUs isn’t sufficient to reach specified RPS. Here we could increase the maximum number of VUs in the test, but we should consider that the machine from which the test is launched has sufficient capacity to support it. In a larger system, tests could be launched from a cluster and scale the number of containers. In any case, with the RPS achieved, it’s sufficient for us to see that the system begins to degrade and return calls with errors, although it doesn’t crash. And when traffic returns to normal levels, the system responds again within set thresholds.
On the other hand, if we open the API Grafana dashboard, we can verify that memory and CPU have increased compared to what was observed in the baseline test, but even at high loads, the curves remain flat, which indicates we don’t have memory leak problems or similar for the tested functionality.
As possible next steps, the reader could investigate where the bottlenecks are that cause latency to increase from certain RPS and why errors occur that make the API not respond with code 200.
6-Final Notes
In this post, we’ve introduced theoretical concepts on how to define a load and performance testing strategy, and then we’ve shown a couple of examples of how to perform some of these tests on an application that implements an API. Although we’ve focused on APIs, these tests are extrapolatable to other systems whose load is variable.
We hope the reader feels they have more tools to answer the questions we posed at the beginning:
How many resources (CPU, RAM, disk, bandwidth, GPU, etc.) does my application consume to process traffic?
What infrastructure do I need to respond to expected traffic?
How fast is my application?
How quickly does my infrastructure scale? What impact does scaling have on users?
Is performance stable or does it degrade over time?
How resilient is my application to traffic spikes?
How does my application’s performance change with new features being introduced?
The type of tests we implement for our final system will depend greatly on the system’s nature, expected usage, and infrastructure.
About Me
For the last 4 years, I’ve been working as CTPO of a startup that develops AI and computer vision-based products for various sectors such as retail, construction, media, and transportation.
I’ve participated in the design of different products, their development and production deployment for clients in 8 countries in Europe, Middle East, and United States.
I’ve led team scalability and transformation, going from an initial group of 4 engineers to a department of 25 professionals, including developers, data scientists, devops, and customer success managers.
Previously, I’ve worked as lead architect and software engineer for different clients (Vodafone, LaLiga, Orange - Optiva Media) and large companies like Amadeus.
Currently, I work as a Fractional CTO helping startups and companies at any stage that have needs and problems with technology and product strategy, team productivity, and promoting engineers to management positions.
If you’re interested in exploring how a Fractional CTO can help you with specific aspects of your company/startup, you can schedule a call.

